Test monitoring can serve various purposes during the project, including the following:
- Give the test team and the test manager feedback on how the testing work is going, allowing opportunities to guide and improve the testing and the project.
- Provide the project team with visibility about the test results.
- Measure the status of the testing, test coverage and test items against the exit criteria to determine whether the test work is done.
- Gather data for use in estimating future test efforts.
For small projects, the test leader or a delegated person can gather test progress monitoring information manually using documents, spreadsheets and simple databases. But, when working with large teams, distributed projects and long-term test efforts, we find that the efficiency and consistency of data collection is done by the use of automated tools.
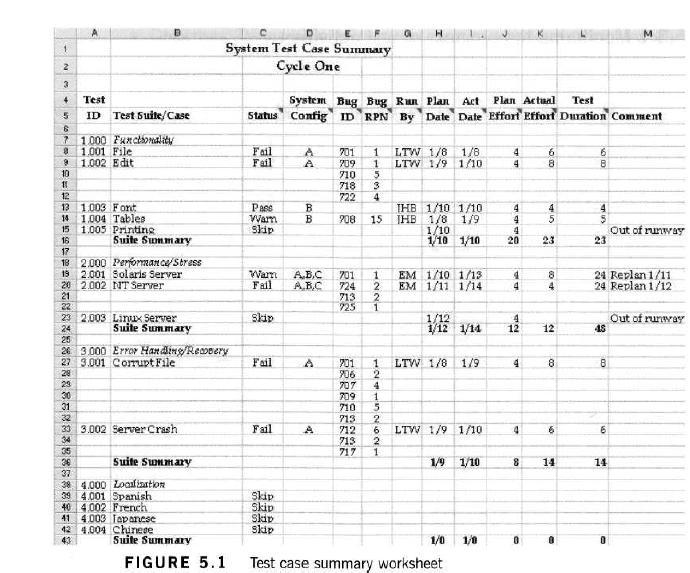
One way to keep the records of test progress information is by using the IEEE 829 test log template. While much of the information related to logging events can be usefully captured in a document, we prefer to capture the test-by-test information in spreadsheets (see Figure 5.1).
 Let us take an example as shown in Figure 5.1, columns A and B show the test ID and the test case or test suite name. The state of the test case is shown in column C (‘Warn’ indicates a test that resulted in a minor failure). Column D shows the tested configuration, where the codes A, B and C correspond to test environments described in detail in the test plan. Columns E and F show the defect (or bug) ID number (from the defect-tracking database) and the risk priority number of the defect (ranging from 1, the worst, to 25, the least risky). Column G shows the initials of the tester who ran the test. Columns H through L capture data for each test related to dates, effort and duration (in hours). We have metrics for planned and actual effort and dates completed which would allow us to summarize progress against the planned schedule and budget. This spreadsheet can also be summarized in terms of the percentage of tests which have been run and the percentage of tests which have passed and failed.
Figure 5.1 might show a snapshot of test progress during the test execution Period. During the analysis, design and implementation of the tests, such a worksheet would show the state of the tests in terms of their state of development.
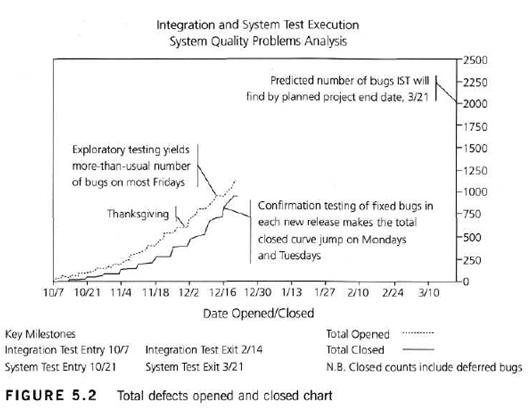
In addition to test case status, it is also common to monitor test progress during the test execution period by looking at the number of defects found and fixed. Figure 5.2 shows a graph that plots the total number of defects opened and closed over the course of the test execution so far. It also shows the planned test period end date and the planned number of defects that will be found. Ideally, as the project approaches the planned end date, the total number of defects opened will settle in at the predicted number and the total number of defects closed will converge with the total number opened. These two outcomes tell us that we have found enough defects to feel comfortable that we’re done testing, that we have no reason to think many more defects are lurking in the product, and that all known defects have been resolved.
Charts such as Figure 5.2 can also be used to show failure rates or defect density. When reliability is a key concern, we might be more concerned with the frequency with which failures are observed (called failure rates) than with how many defects are causing the failures (called defect density).
In organizations that are looking to produce ultra-reliable software, they may plot the number of unresolved defects normalized by the size of the product, either in thousands of source lines of code (KSLOC), function points (FP) or some other metric of code size. Once the number of unresolved defects falls below some predefined threshold – for example, three per million lines of code – then the product may be deemed to have met the defect density exit criteria.
That is why it is said, test progress monitoring techniques vary considerably depending on the preferences of the testers and stakeholders, the needs and goals of the project, regulatory requirements, time and money constraints and other factors.
In addition to the kinds of information shown in the IEEE 829 Test Log Template, Figures 5.1 and Figure 5.2, other common metrics for test progress monitoring include:
- The extent of completion of test environment preparation;
- The extent of test coverage achieved, measured against requirements, risks, code, configurations or other areas of interest;
- The status of the testing (including analysis, design and implementation) compared to various test milestones;
The economics of testing, such as the costs and benefits of continuing test execution in terms of finding the next defect or running the next test.
Other popular articles:
- What are Test management tools?
- What are the 7 principles of testing?
- What is Test Monitoring and Test Control?
- What is test status report? and How to report test status?
- How to define, track, report & validate metrics in software testing?


Leave a Reply